


 11 / 60

V-Belts
Installation Guide
V-Belts
Installation Guide
13. Tension
Proper tension is essential for maximum belt life and efficiency.
Improper belt tension is the primary cause of premature
belt failure and increased costs. Under-tensioned belts lead to
slippage, overheating, rollover and noise, all of which lead to
higher maintenance costs and inefficient transmission of power.
Also, over-tensioning belts leads to premature wear, along with
bearing, shaft and sheave problems. The result is more frequent
replacement of drive components and costly downtime.
Common sense rules of V-belt tensioning
The ideal tension is the lowest tension at which the belt will not
slip under peak load conditions.
Check the belt tension frequently during the first 24-48 hours
of run-in operation.
Do not over-tension belts. Doing so will shorten belt and bearing life.
Keep belts free from foreign materials that may cause slippage.
Inspect the V-drive periodically. Re-tension the belts if they
are slipping.
Maintain sheave alignment with a strong straight-edge tool
while tensioning V-belts.
Table 4 HY-T® Wedge and Wedge TLP™ V-Belts
Minimum Allowance Below Standard Center Distance
for Installation of Belts (in.)
Standard Length
Designation
3V,
3VT
3V
Torque
Team®
5V,
5VT
5V
Torque
Team®
8V,
8VT
8V
Torque
Team®
Minimum Allowance Above Standard
Center Distance for Maintaining Tension
All Cross Sections
Up to and including 475
0.5
1.2
1.0
Over 475 to and including 710
0.8
1.4
1.0
2.1
1.2
Over 710 to and including 1060 0.8
1.4
1.0
2.1
1.5
3.4
1.5
Over 1060 to and including 1250 0.8
1.4
1.0
2.1
1.5
3.4
1.8
Over 1250 to and including 1700 0.8
1.4
1.0
2.1
1.5
3.4
2.2
Over 1700 to and including 2000
1.0
2.1
1.8
3.6
2.5
Over 2000 to and including 2360
1.2
2.4
1.8
3.6
3.0
Over 2360 to and including 2650
1.2
2.4
1.8
3.6
3.2
Over 2650 to and including 3000
1.2
2.4
1.8
3.6
3.5
Over 3000 to and including 3550
1.2
2.4
2.0
4.0
4.0
Over 3550 to and including 3750
2.0
4.0
4.5
Over 3750 to and including 5000
2.0
4.0
5.5
11
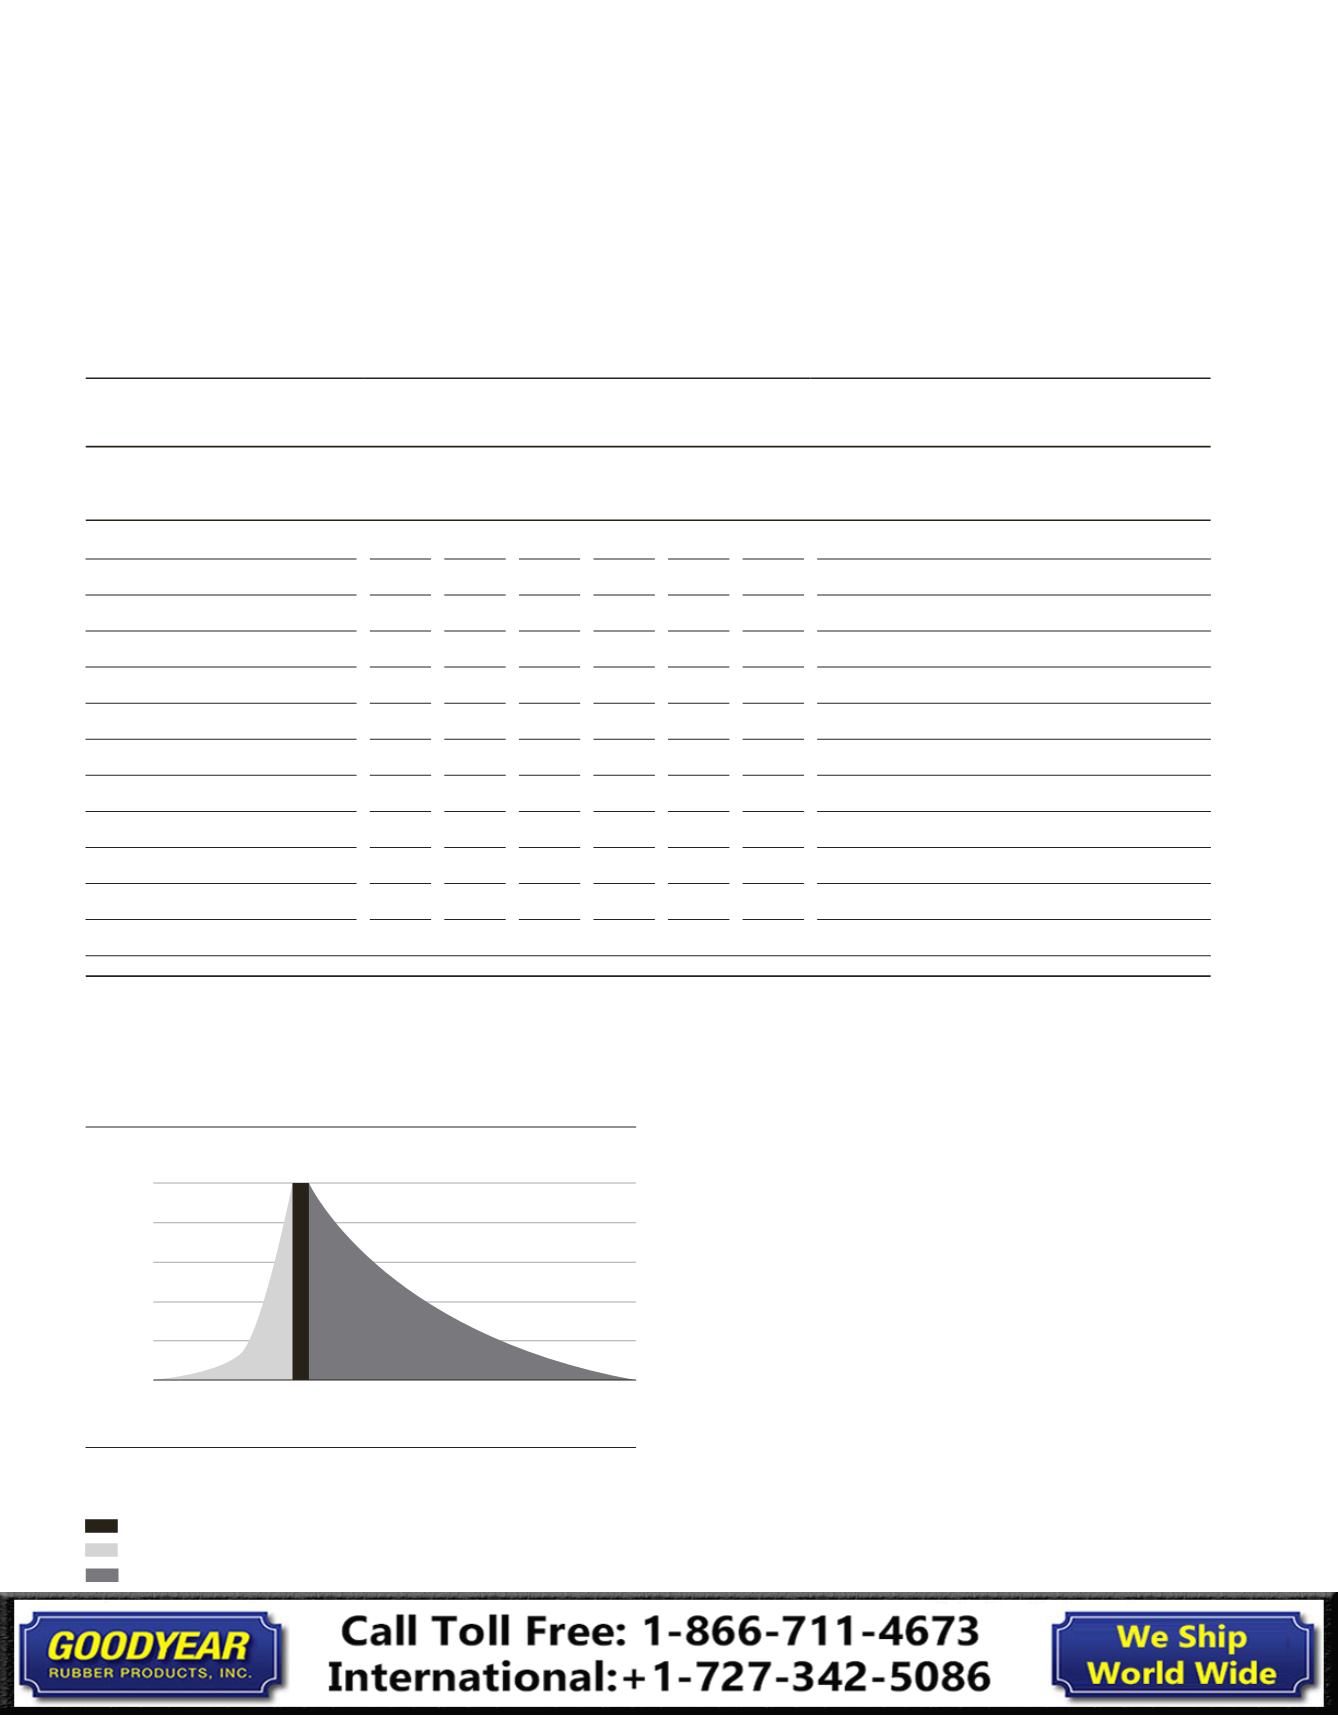
‹
Under-Tensioned
Over-Tensioned
›
Belt Life Expectancy
100%
80%
60%
40%
20%
0%
Belt Tension
Optimal Belt Tension
Under-Tensioned
Over-Tensioned
Belt Life Expectancy vs. Tension
100% of Belt Life